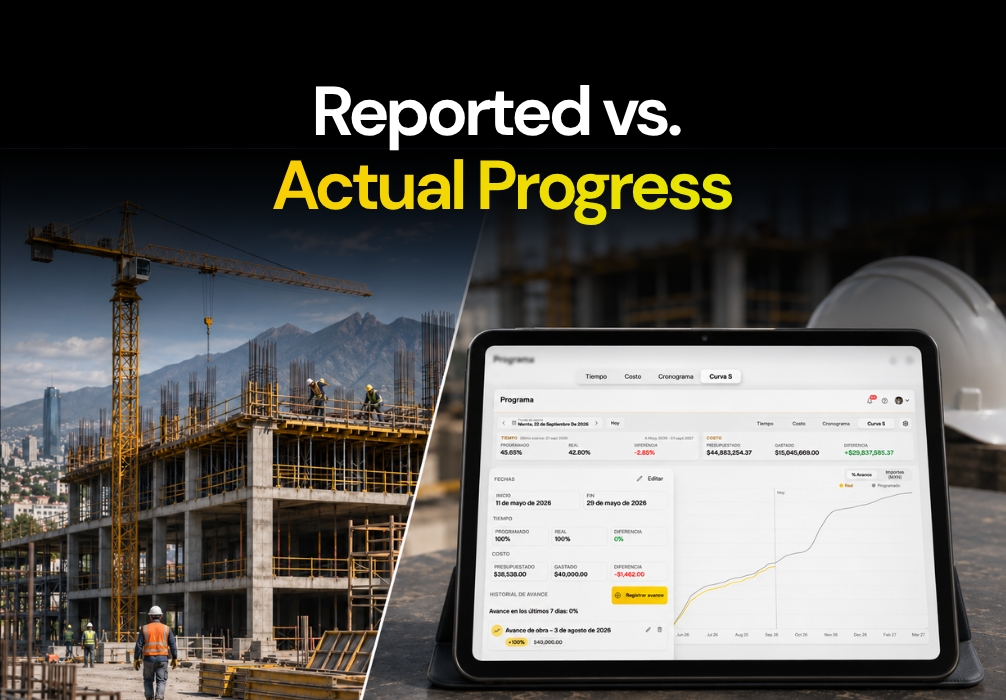
The report says the project is 70% complete. But when you arrive on-site, you find activities that aren't finished yet.
Is the progress calculated incorrectly? Is it being measured using a different criterion? Or does the report simply not reflect what is happening in the field?
A construction progress report should help you answer those questions. It’s not just about showing a percentage; it’s about comparing actual work against the schedule, identifying delays, and deciding what to do before they become a bigger problem.
And now that the end of 2026 is approaching, it’s worth asking yourself: is the progress you are reporting the same progress you will use to plan 2027?
What a progress report should say
A good progress report doesn't need to be complicated, but it must allow someone who wasn't on-site to understand what happened during the period.
To start, it needs to identify the exact activity. Writing "masonry progress" is not the same as "block walls, level 3, tower B." The clearer the scope, the easier it will be to compare it with the schedule.
Next comes the progress. Here, it is important to distinguish between what was executed during the period and the cumulative total. An activity may have made significant progress this week and still be behind schedule due to what was left pending in previous weeks.
Evidence also counts. Dated and geotagged photographs, along with the corresponding measurements, help verify what work was performed. The construction supervisor's checklist can serve as a reference for defining what to record during site walks.
And if something hindered progress, it must also be documented. A work front stopped due to a lack of materials is not the same as one affected by rain or by a previous activity that hasn't been cleared yet. Each situation requires a different decision.
Finally, it is advisable to identify who prepared the report and who reviewed the information. Recording progress is not the same as verifying that it is correct.
Planned vs. actual, at a glance
Percentage of completion, on its own, only tells part of the story. To know if an activity is on track, you need to compare it with the construction schedule.
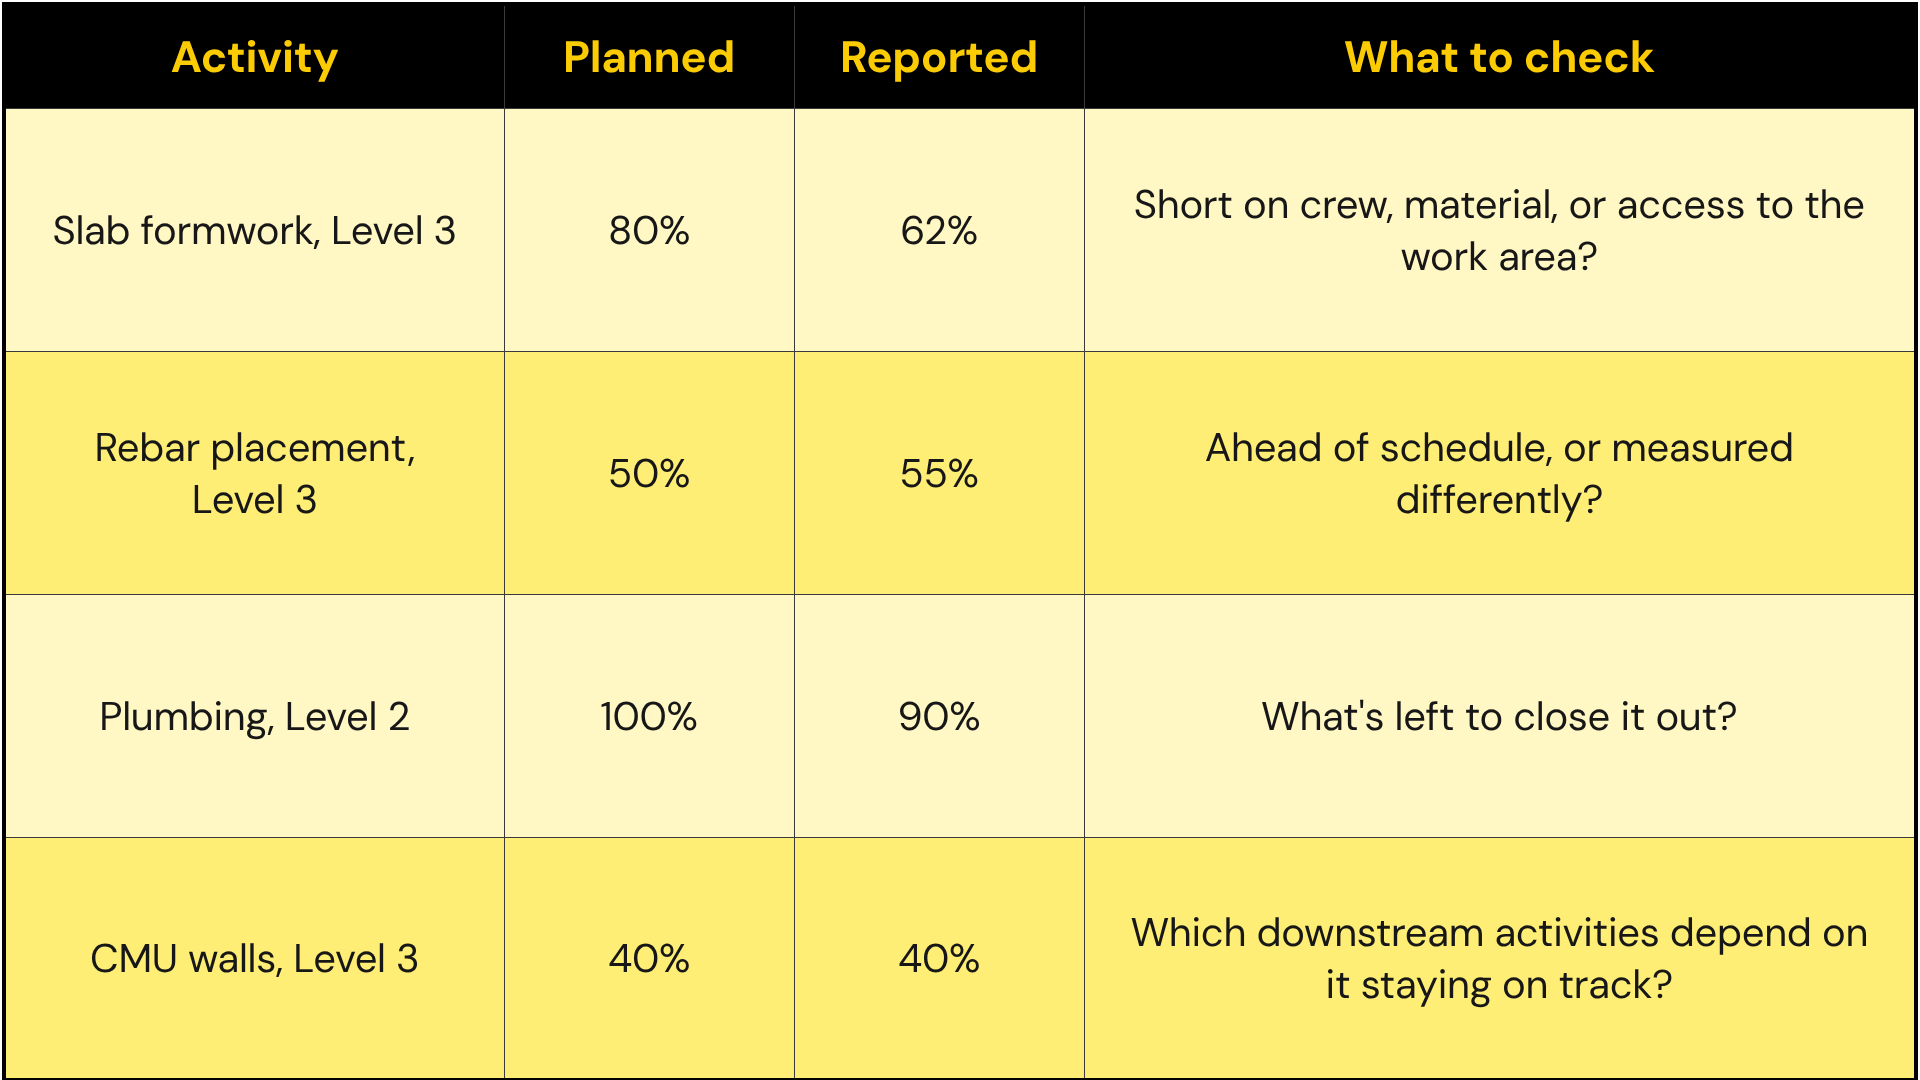
Imagine that a construction project reports these results at the end of the week:
Illustrative example; does not correspond to a real project.
The first row immediately grabs your attention: formwork is 18 percentage points behind schedule.
But the last one also deserves monitoring.
Just because an activity is going exactly as planned doesn't mean you can stop keeping an eye on it. If it is on the critical path, any subsequent delay could affect the project's completion date.
The same applies to activities that are ahead of schedule. Being ahead of the plan can be good news, provided that progress is measured using the same criteria and does not create conflicts with other tasks.
The percentage tells you how much you have progressed. The relationship between activities helps you understand how important that progress is.
How to read variance without losing your mind
A one-time variance from the planned progress does not always mean the delivery date is at risk. The problem arises when the gap between what was planned and what was executed begins to grow and affects important project activities.
Imagine that by week 10 you were supposed to have 45% cumulative progress, but you are actually at 41%. That represents a negative variance of four percentage points relative to the planned progress.
Two weeks later, the gap grows to seven points. And by week 14, it is ten.
That is when the conversation changes. It is no longer just about explaining why an activity was delayed, but about understanding what is causing the project to drift further and further away from the schedule.
To visualize that trend, the S-curveis useful, as it compares cumulative planned progress with cumulative actual progress over time.
When both curves begin to diverge, there is a variance that deserves attention. But the chart alone does not tell you if the final date will be affected or how to make up for lost time.
To do that, you need to review which activities are causing the variance, which ones have critical dependencies, and how much room there is to adjust execution.
A good review should answer three questions:
Is the variance growing or stabilizing? Maintaining a four-point delay is not the same as accumulating a new one every week.
Which activities are causing the deviation? Identifying them allows you to focus your efforts where it really matters.
What can be recovered without compromising other activities? Accelerating one front doesn't always solve the problem if it depends on work that is still pending.
The S-curve helps detect the trend. Schedule analysis allows you to decide what to do about it.
Transforma la forma en que gestionas tus proyectos de construcción.
Daily or weekly reporting: it depends on what you need to decide
Not all construction projects require the same reporting frequency.
On a project with multiple active fronts, different crews, and interdependent activities, a daily report can help detect issues before they affect the next day's work.
Conversely, when the pace of execution is more stable, a weekly report may be sufficient to evaluate trends and track commitments.
The goal isn't to fill out more forms, but to have useful information when it's needed.
For example, if the progress meeting is on Monday, but the previous week's reports don't arrive until Wednesday, the team ends up making decisions based on outdated information.
The right frequency is the one that allows you to detect and address problems in time.
Physical progress vs. financial progress: why they don't always align
A project may be advancing physically without that progress being reflected in its estimates yet.
There may also be an advance payment that does not correspond directly to completed work.
That is why, when someone asks how far along a project is, it is best to clarify which type of progress you are talking about.
The physical progress reflects the work performed, measured according to the criteria established for the project.
The financial progress can refer to different figures, such as the value of work performed, estimated costs, or payments made. It is important to specify which one is being used to avoid comparing data that represent different things.
Imagine that the physical report shows 60% progress and the estimate control indicates 80%. Before concluding there is a problem, you should check if both percentages use the same base and scope.
There may be differences in the weighting of activities, the concepts included, or the timing of when each amount is recognized.
The difference between the two indicators does not always mean something is wrong, but it is a sign that it is worth reviewing what is being measured.
Five signs that your report makes you look better than you actually are
Sometimes the problem isn't the schedule. It's the way progress is recorded.
There are signs you should check before trusting a percentage.
1. The report is put together from memory. If progress is recorded several days after the site walk, it is easier to confuse work fronts, dates, or quantities.
2. A percentage appears without a clear scope. Saying that "masonry is at 70%" is of little use if you don't know which activities, levels, or areas it includes.
3. The evidence is somewhere else. If photographs, measurements, and observations do not accompany the report, verifying progress can turn into a search through folders and conversations.
4. Practically the same thing is reported every week. This does not necessarily mean the data is incorrect, but it is worth verifying that progress is being measured and not just calculated out of habit.
5. The report arrives after the decision has already been made. Information may be accurate, but it loses much of its value if it arrives after the meeting, the rescheduling, or the resource allocation.
These issues aren't solved by writing longer reports. They are solved with clear criteria, sufficient evidence, and data capture that is integrated into daily workflows.
That is the logic behind a project with real control: information should help coordinate what comes next, not just document what has already happened.
What to do when the report and the site work don't match
Suppose a site manager reports 80% progress on an activity, but during a review, another team member believes the work completed is less than that.
The initial reaction might be to ask them to change the percentage. But first, it is worth understanding where the discrepancy comes from.
Are they considering the same scope? Are they using the same unit of measurement? Does the percentage include work that isn't finished yet? Does the schedule view the activity differently than how it is reported in the field?
First, review the activity and the measurement criteria. Then, compare what was recorded against the executed quantities and their supporting evidence.
If there is a discrepancy, the report must be corrected with verifiable information, rather than simply swapping one figure for another.
And if the problem is that each person is using a different criterion, you must agree on one that can be maintained for the rest of the project.
The goal is not to find out who made a mistake, but to ensure that everyone is making decisions based on the same information.
Three checkpoints before the year ends
As we head into the final stretch of 2026, it’s a good time to review the actual status of projects before preparing for the 2027 kickoff.
You don’t need to wait until the last day of the year to do it.
First checkpoint: identify the deviations you can still address.
Compare the scheduled progress against the actual progress, especially for activities that support key dates. You don’t need to start with an endless list: identify the areas with the greatest deviation and check which ones might affect the rest of the schedule.
Second checkpoint: document the state of the site during the December break.
Before pausing activities, make it clear which tasks were completed, which are still in progress, and what conditions each area needs to resume work.
The holiday breaks are easier to manage when the status of each activity is documented. It also avoids arguments in January about what was left pending.
Third checkpoint: prepare for 2027 with actual progress.
Upon returning, review which activities remained open, what constraints are still present, and what adjustments the schedule needs.
A schedule updated with field information is much more useful than one that retains percentages that no longer reflect reality.
The purpose of these three checkpoints is not to produce more reports. It is to prevent the new year from starting with decisions based on outdated information.
What changes when the report is captured on-site
The five signs above have something in common: almost all of them appear between the site walk and the moment the progress reaches the schedule. That is where Buildpeer helps.
Capture progress directly on-site. If reports are usually put together from memory, you can now capture them directly at the work front. Using the Buildpeer app, site managers can record progress and add photos even without an internet connection. Reports can be completed and published offline, and they will automatically sync once the connection is restored.
Link every report to a specific activity. To avoid vague progress percentages, reports cannot be saved without being tied to a scheduled activity. Progress is linked to specific items like "block walls, level 3, tower B" rather than general categories like "masonry," and can be captured by percentage, quantity, or cost.
Keep evidence alongside reported progress. If evidence is located elsewhere, photos can be added to the same report; if location services are enabled on your phone, they will be timestamped and geotagged. Each activity consolidates all its evidence—including reports, tasks, documents, and submittals—along with its full progress history.
Compare planned versus actual progress during capture. If you find yourself reporting the same data every week, the site manager can view previous progress, the current schedule target, and the cumulative total while capturing new data. By comparing the plan against actuals in real-time, any discrepancies are identified before the report is even published.
Update tracking without duplicating data entry. Once a report is published, the progress is automatically incorporated into the activity and updates the S-curve, eliminating the need for manual data entry into the schedule. Before publishing, a preview allows you to review the full report and its assignments.
And if you're dealing with a problem or a delay rather than just progress, each issue gets its own report instead of getting lost in a conversation thread.
The platform helps connect data capture with project tracking, but the responsibility for accurate measurement and verification of work remains with the site team. You can learn more about these tools in the Buildpeer platform.
Conclusion
A progress report shouldn't just tell you how much has been built. It should help you determine if the project is moving according to plan and what needs to be corrected before a minor deviation turns into a major delay.
To wrap up 2026, having complete reports isn't enough. What matters is that the recorded information reflects the actual progress of the work and enables data-driven decision-making.
With Buildpeer, reports are linked to the project schedule, allowing you to track progress from a single platform.
What should you do if a report shows 80% progress, but it looks like much less on-site?
Before correcting the percentage, review how it is being measured. There may be discrepancies between the program's criteria and those used in the field. Identify the activity, verify the quantities executed, and compare the result with the evidence. Adjustments must be based on verifiable measurements, not perceptions.
Can a project be behind schedule even if this week's report shows good progress?
Yes. An activity can meet its weekly goal and still carry delays from previous periods. That is why it is important to review both the period progress and the cumulative progress, and compare them against the current schedule.
What does it mean when the actual S-Curve is below the planned one?
It means that, based on the measurement criteria used, the actual cumulative progress is less than projected. To determine if this difference jeopardizes the completion date, you must review which activities are causing it, their dependencies, and the float available in the schedule.
What should be done when two site engineers report different progress for the same activity?
First, verify that they are referring to the same scope, period, and unit of measurement. Then, compare the quantities and field evidence. Agreeing on a common criterion prevents the cumulative total from changing depending on who prepares the report.
How can you prevent progress reports from becoming files that no one ever looks at?
Link every report to a scheduled activity, record issues that require attention, and establish who is responsible for reviewing the information. In Buildpeer, progress reports are linked to scheduled activities, and their data feeds directly into project tracking.